Uncorking the Data
Data Visualization
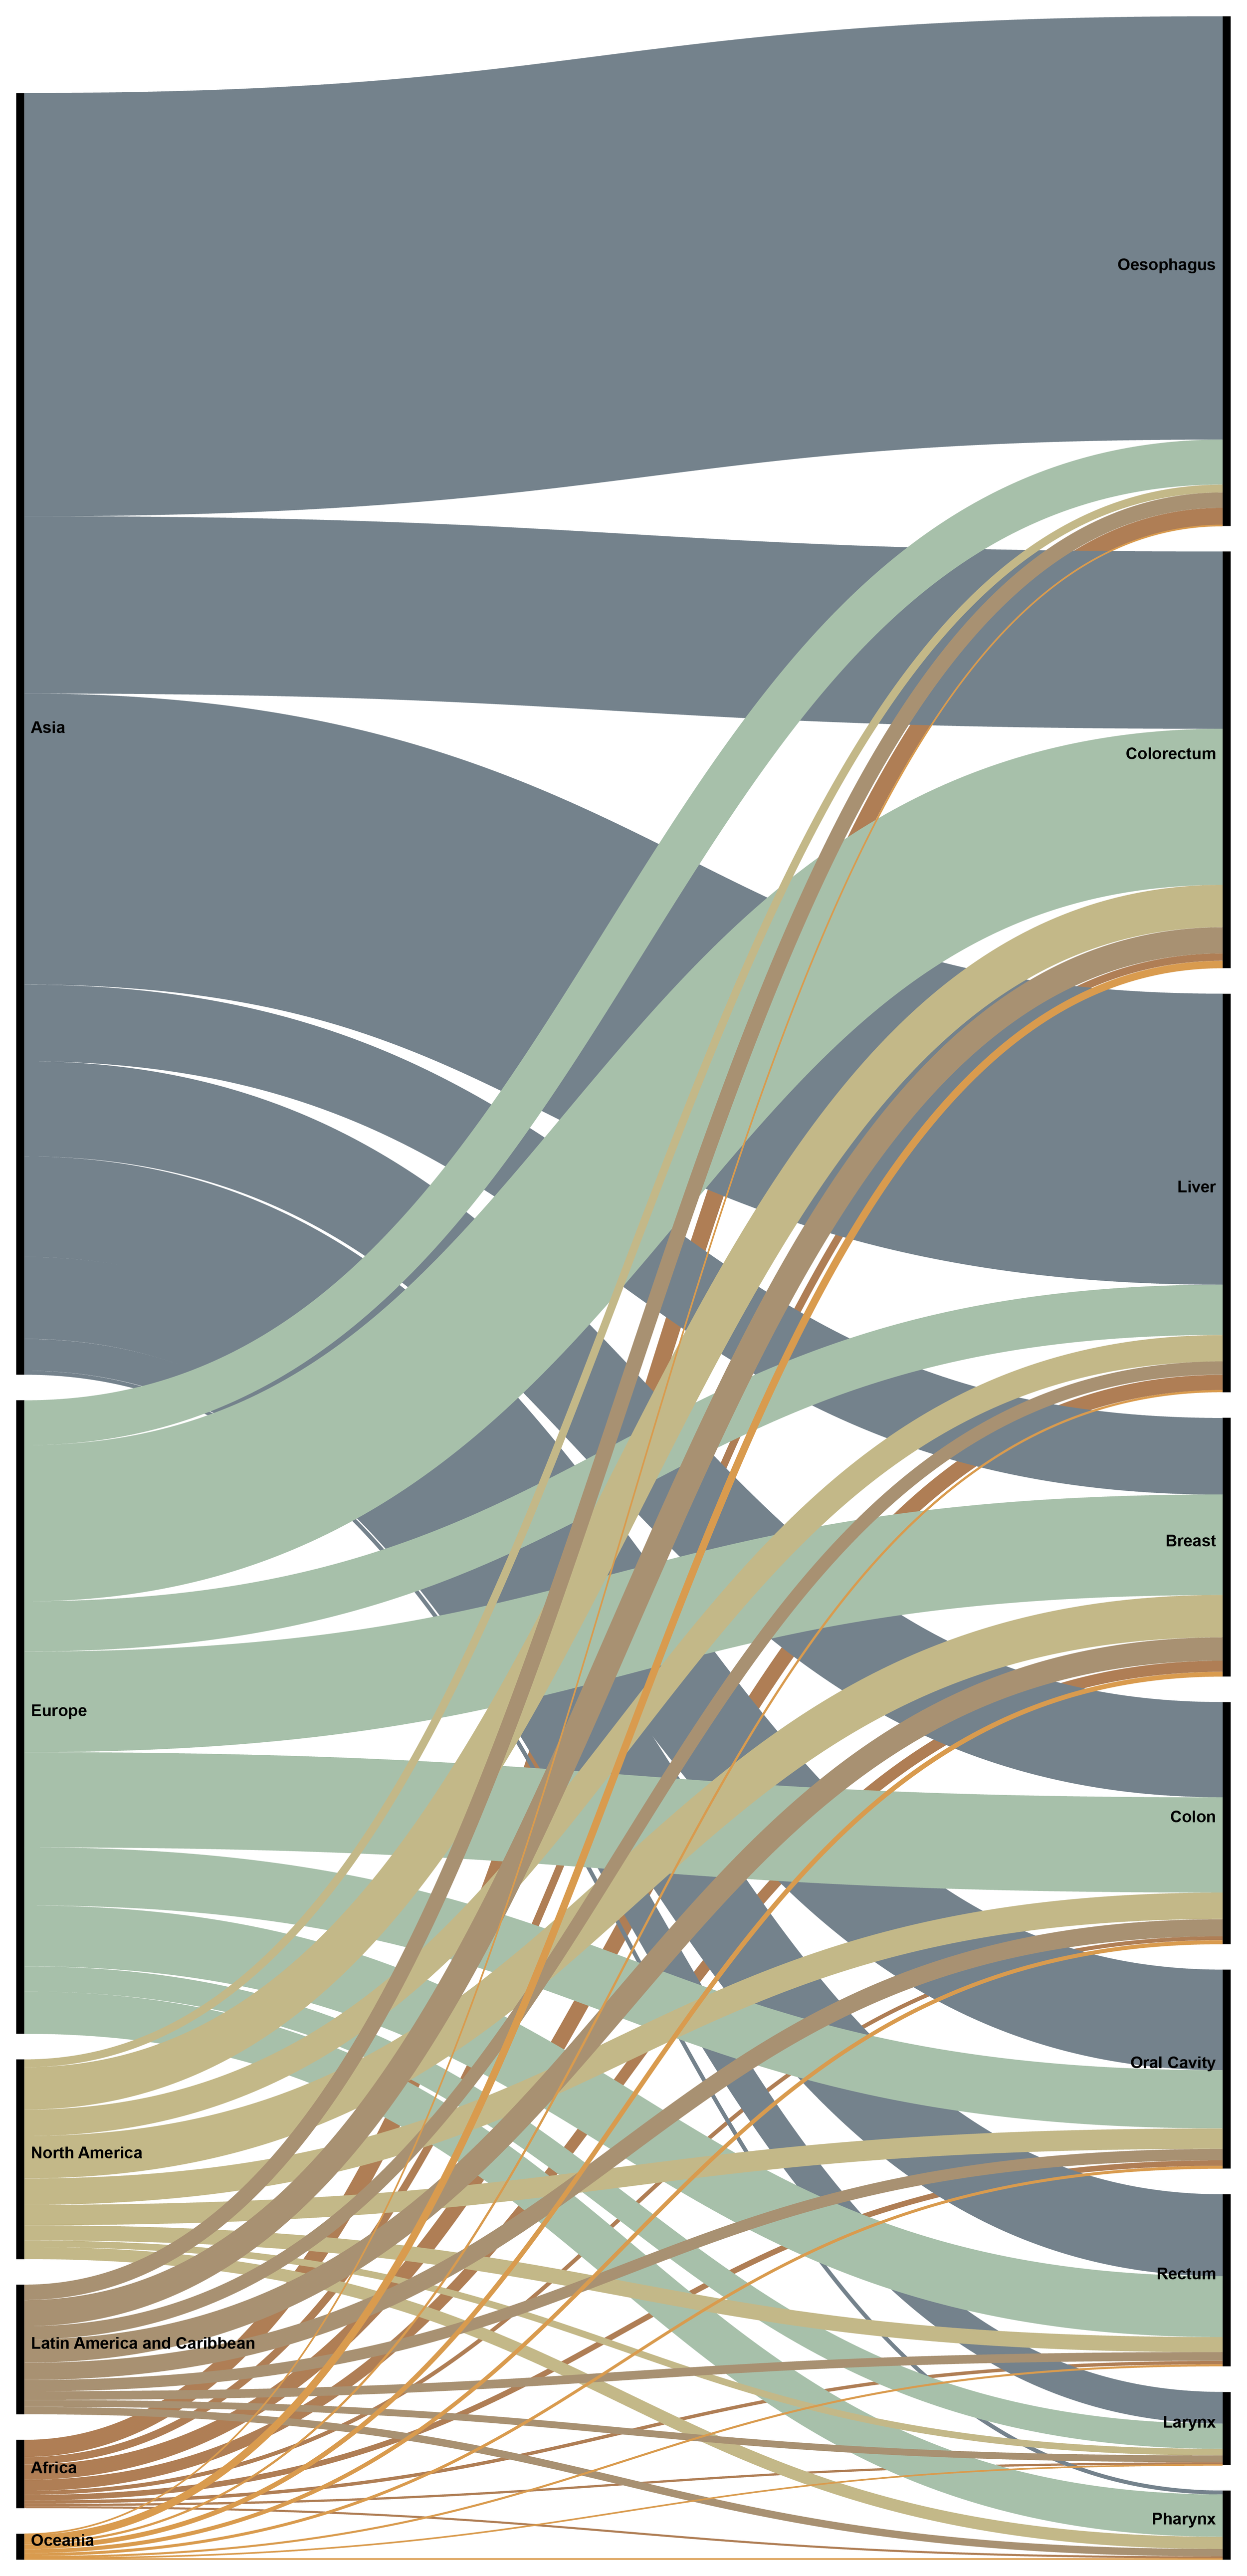
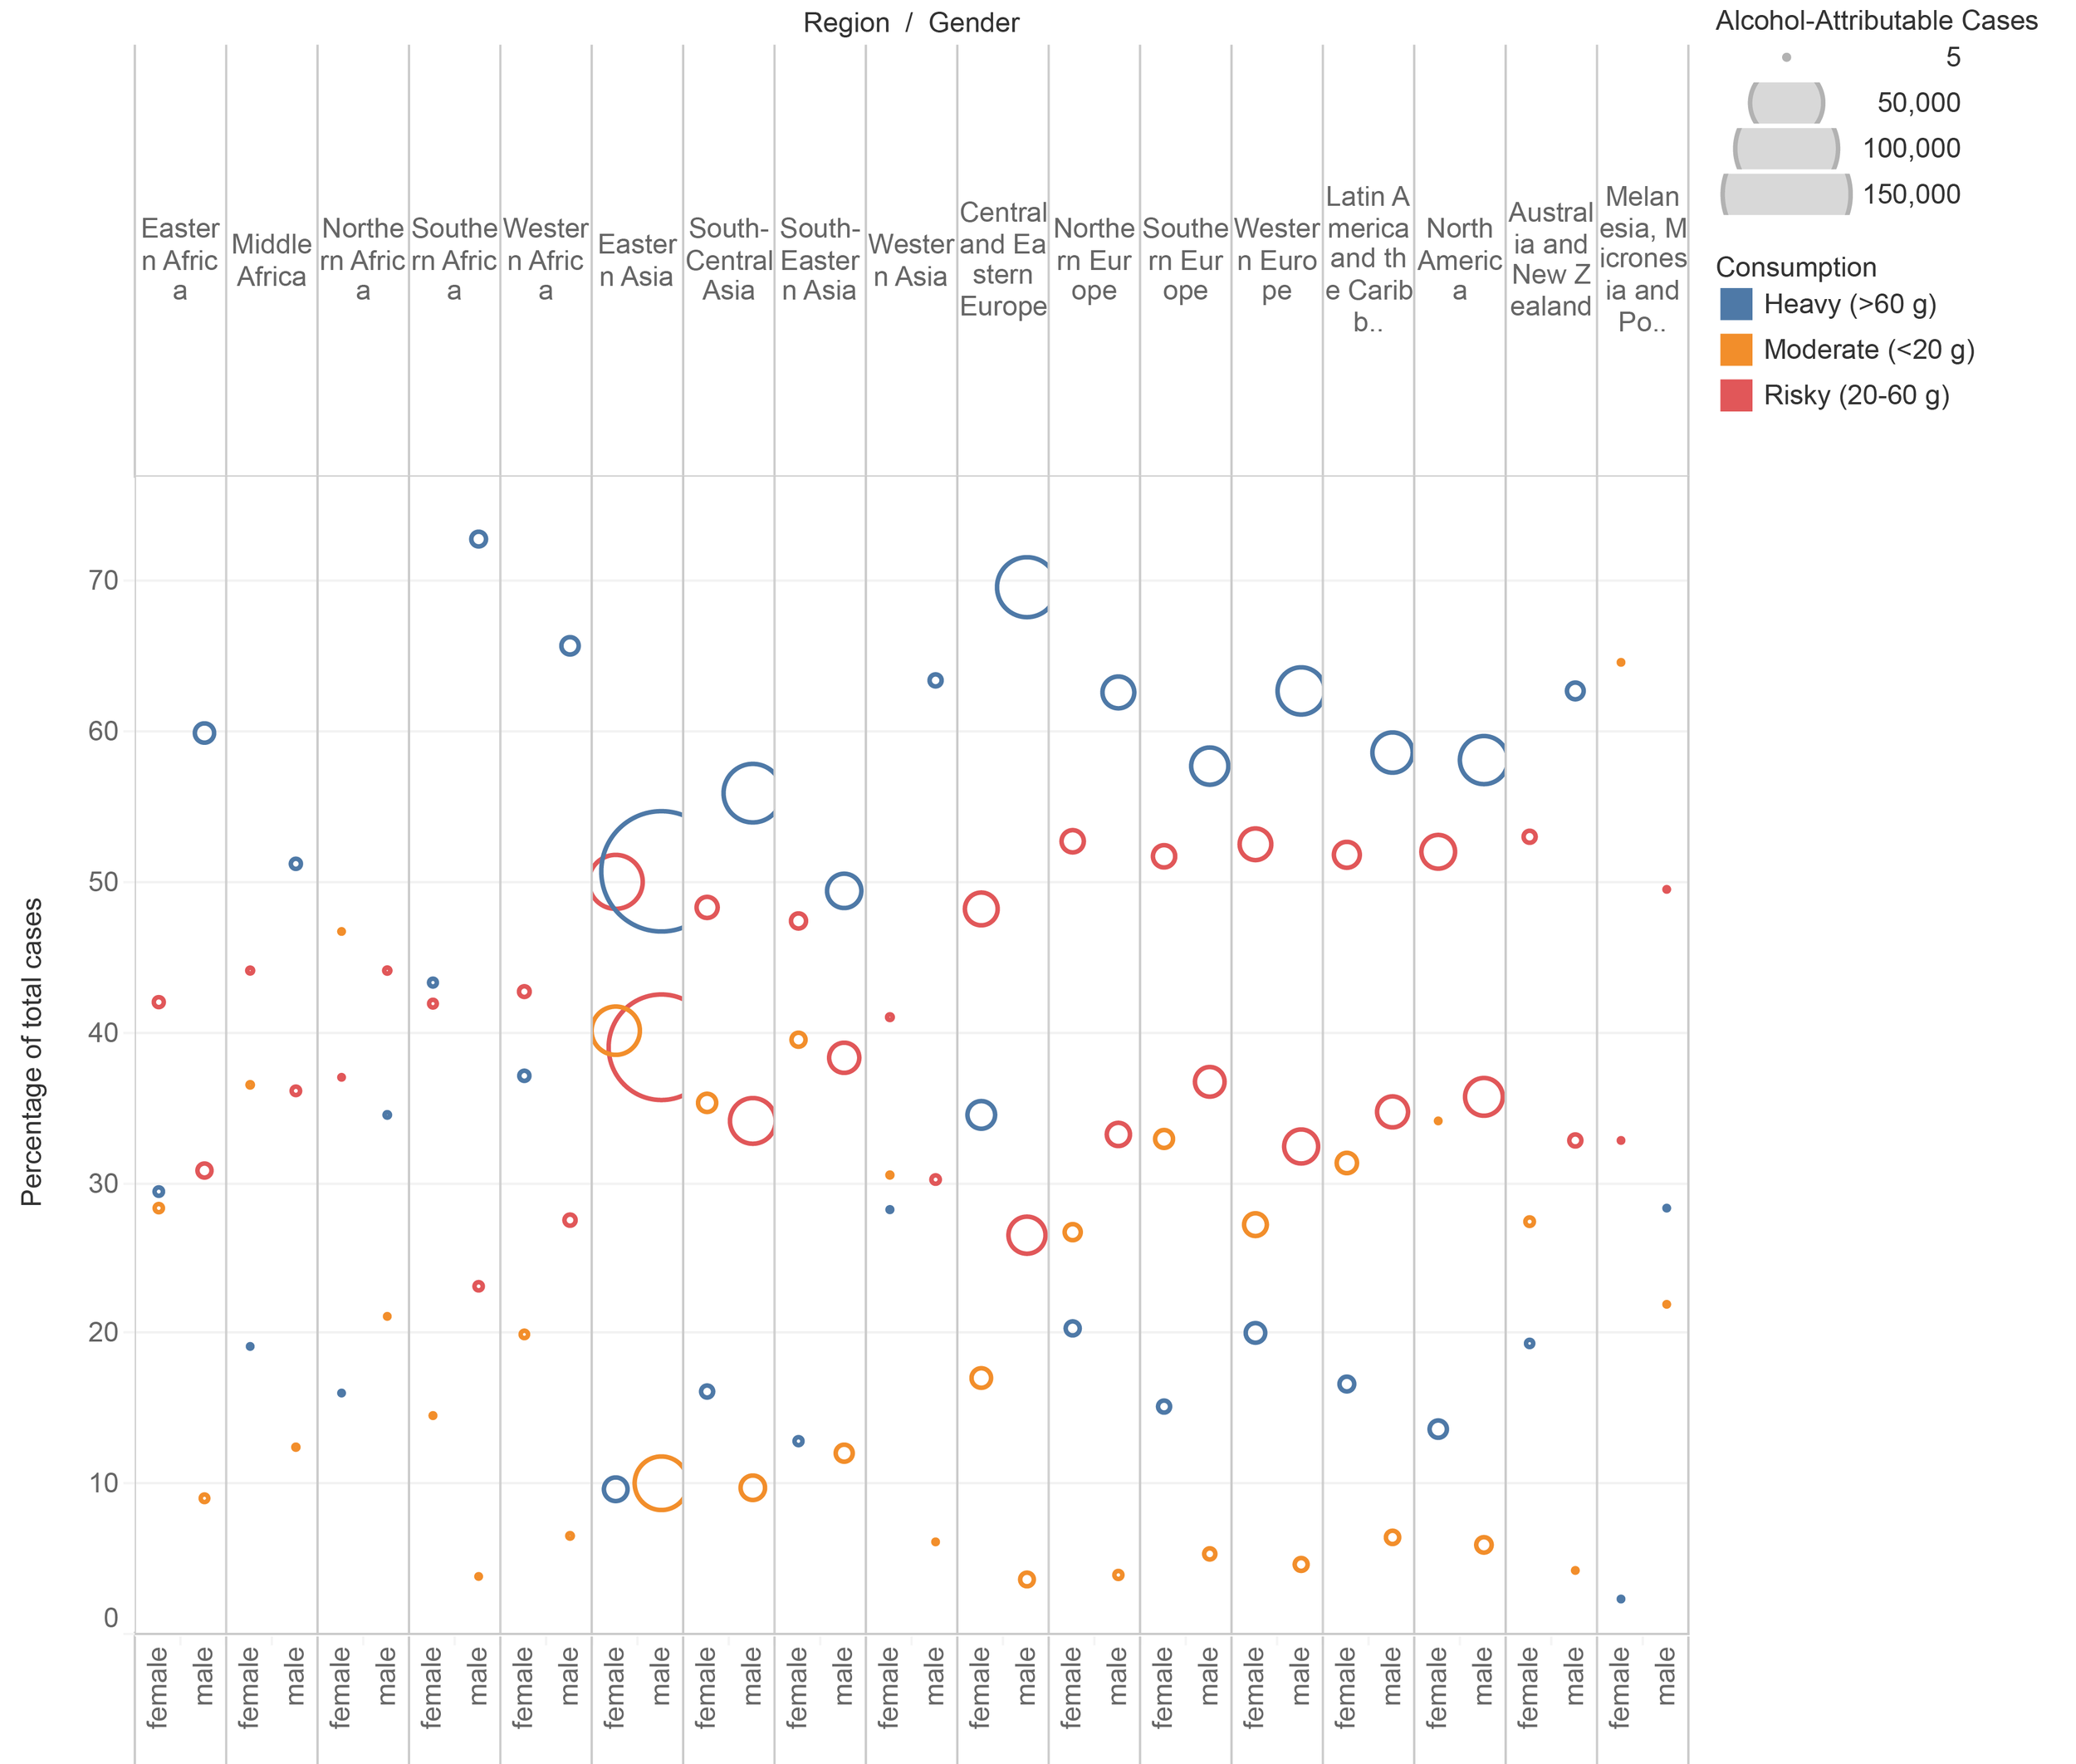
A visual exploration of cancers attributable to alcohol consumption.
-
Jodi Jenkinson
-
Data Visualization
-
Adobe Illustrator, Microsoft Excel, Tableau, Rawgraphs


The purpose of this project was to explore techniques in data visualization on a topic of our choosing.
My research began on the WHO website, on a page under International Agency for Research on Cancer that is dedicated to Cancers Attributable to Alcohol. Here, they have public data and analysis tools that lead me to these original data sources.
Rumgay, H., Shield, K., Charvat, H., Ferrari, P., Sornpaisarn, B., Obot, I., ... & Soerjomataram, I. (2021). Global burden of cancer in 2020 attributable to alcohol consumption: a population-based study. The Lancet Oncology, 22(8), 1071-1080.
Rumgay, H., Murphy, N., Ferrari, P., & Soerjomataram, I. (2021). Alcohol and cancer: epidemiology and biological mechanisms. Nutrients, 13(9), 3173.

Color palettes and inspiration….
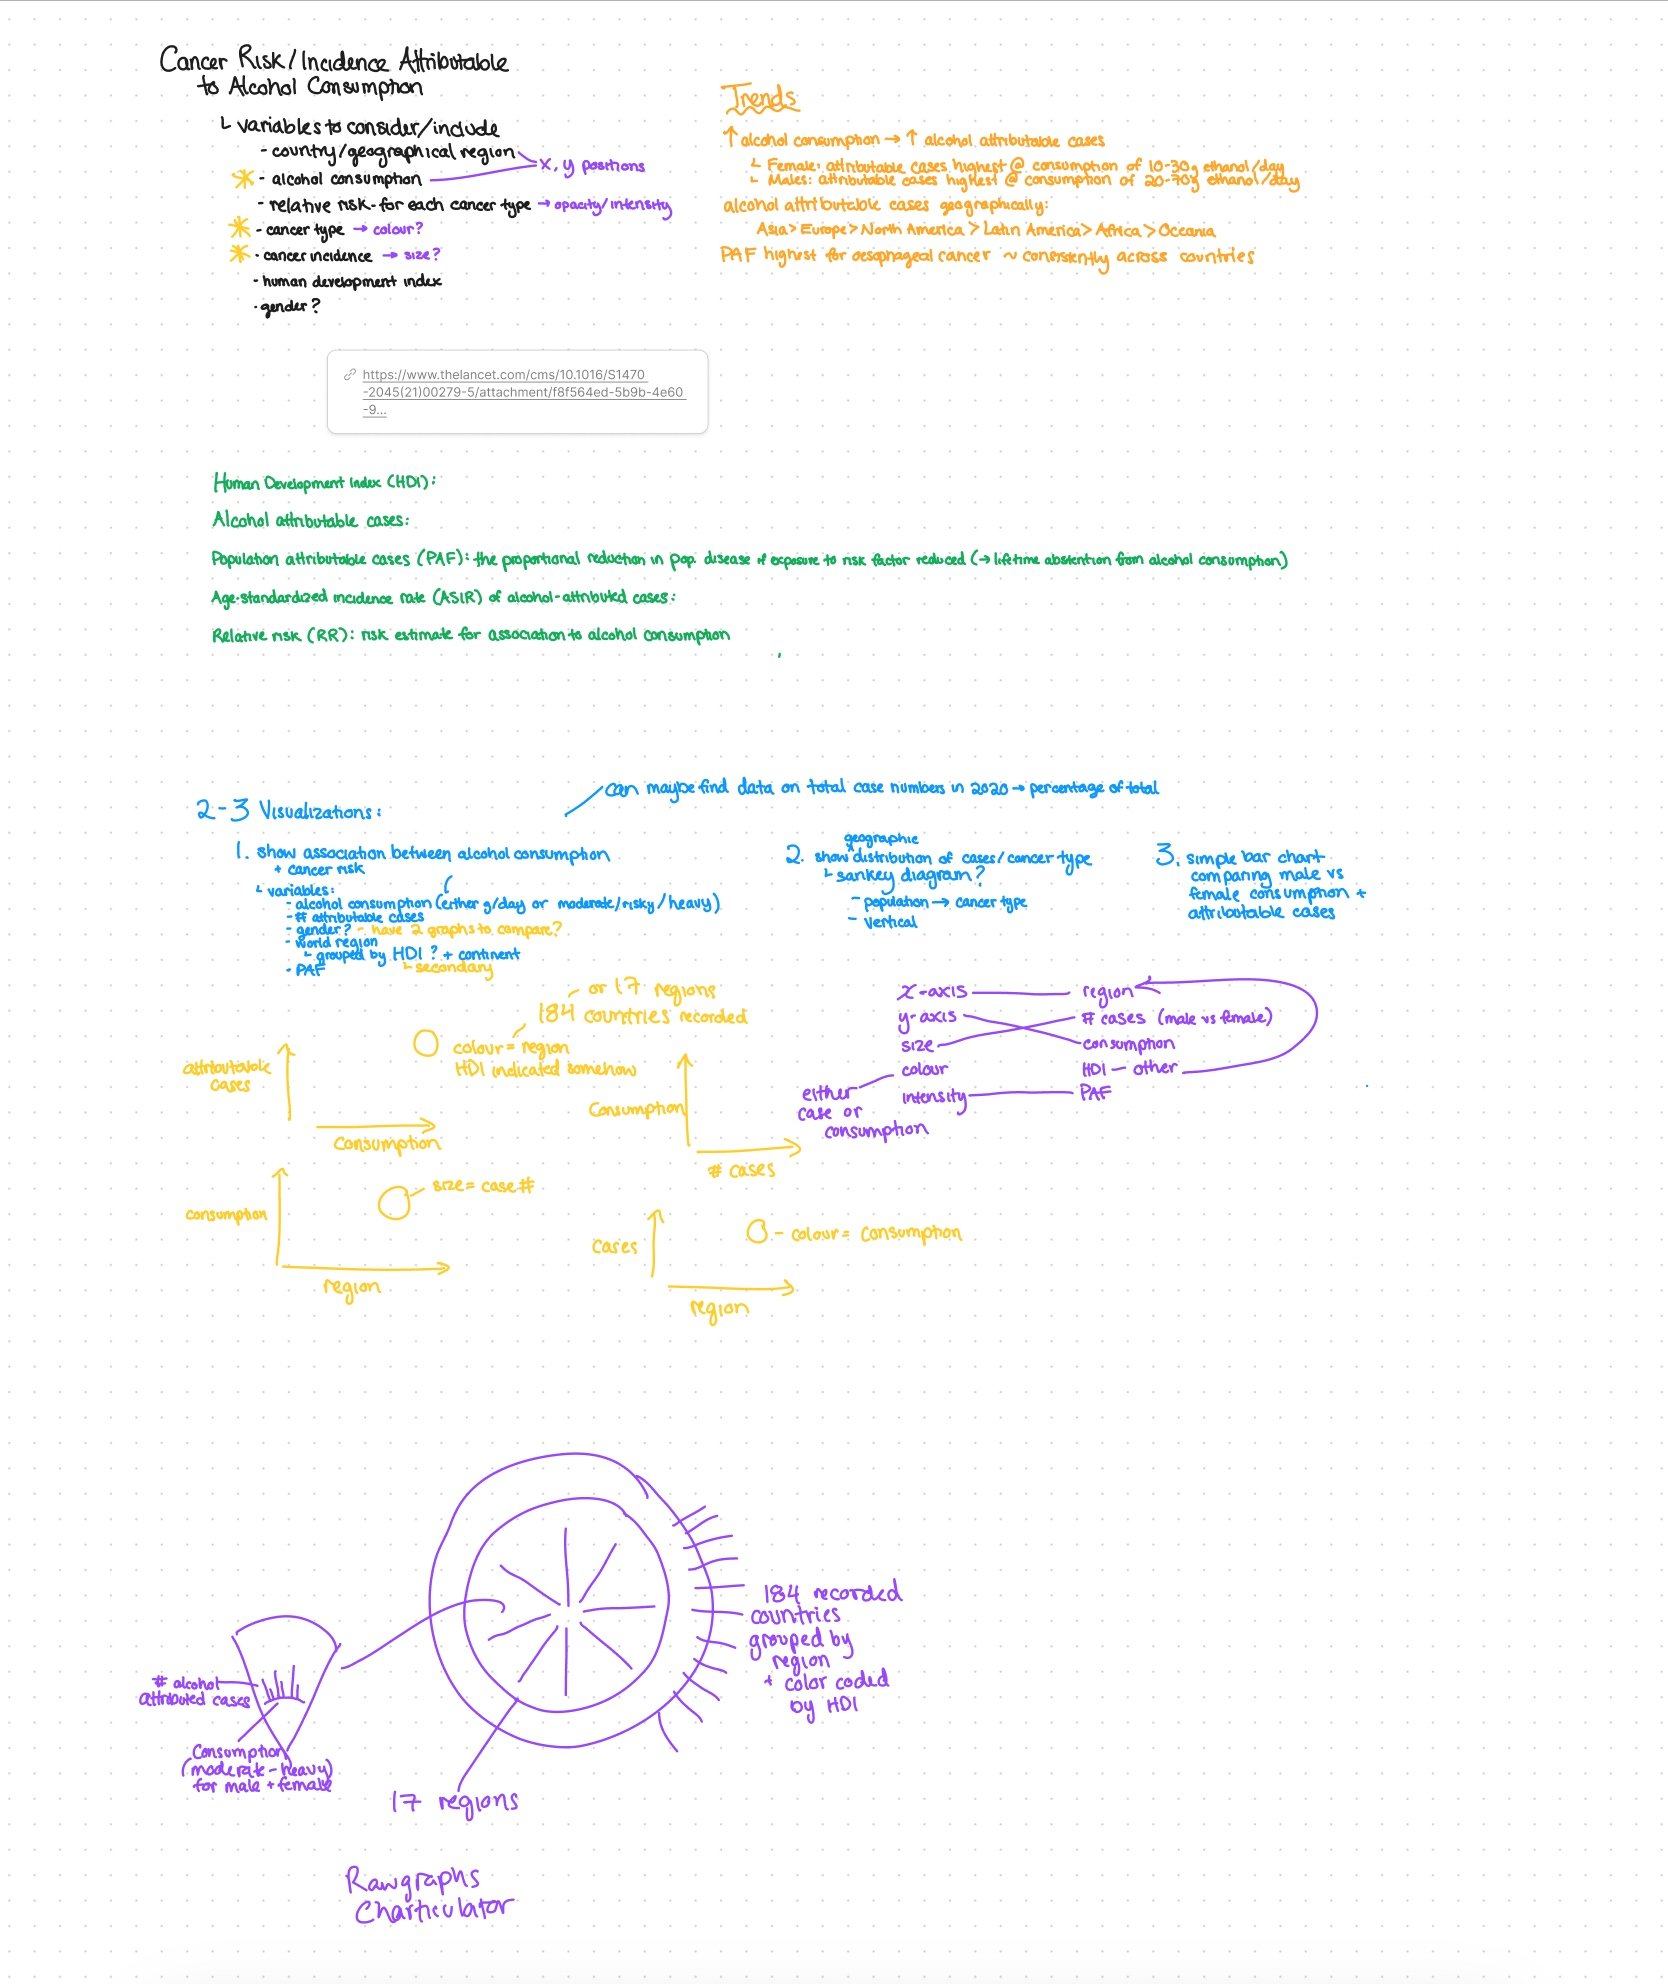
Planning and drafting stages

Data analysis and formatting